In this chapter, we used matplotlib extensively to plot and visualize our color histograms.
When it comes to plotting, matplotlib tends to be the de facto standard for the Python programming language; however, other libraries do exist.
One of my personal favorites is plot.ly, which is a combination library + API. You can create an account for free with plot.ly, but for some of the more advanced features, you’ll need to register for a paid account. If you find yourself needing to create (beautiful) plots often, the paid account is well worth the price.
Getting errors with matplotlib?
If you are getting any type of errors related to the matplotlib library, including plots not being properly displayed to your screen, then please refer to this page on the companion website, which provides insights to solve these issuers and errors.
Applications of color histograms
The purpose of this chapter was to learn how to extract and visualize color histograms from an image. But other than simply visualizing the color distribution of an image, can we do more?
What are the actual applications of utilizing color histograms?
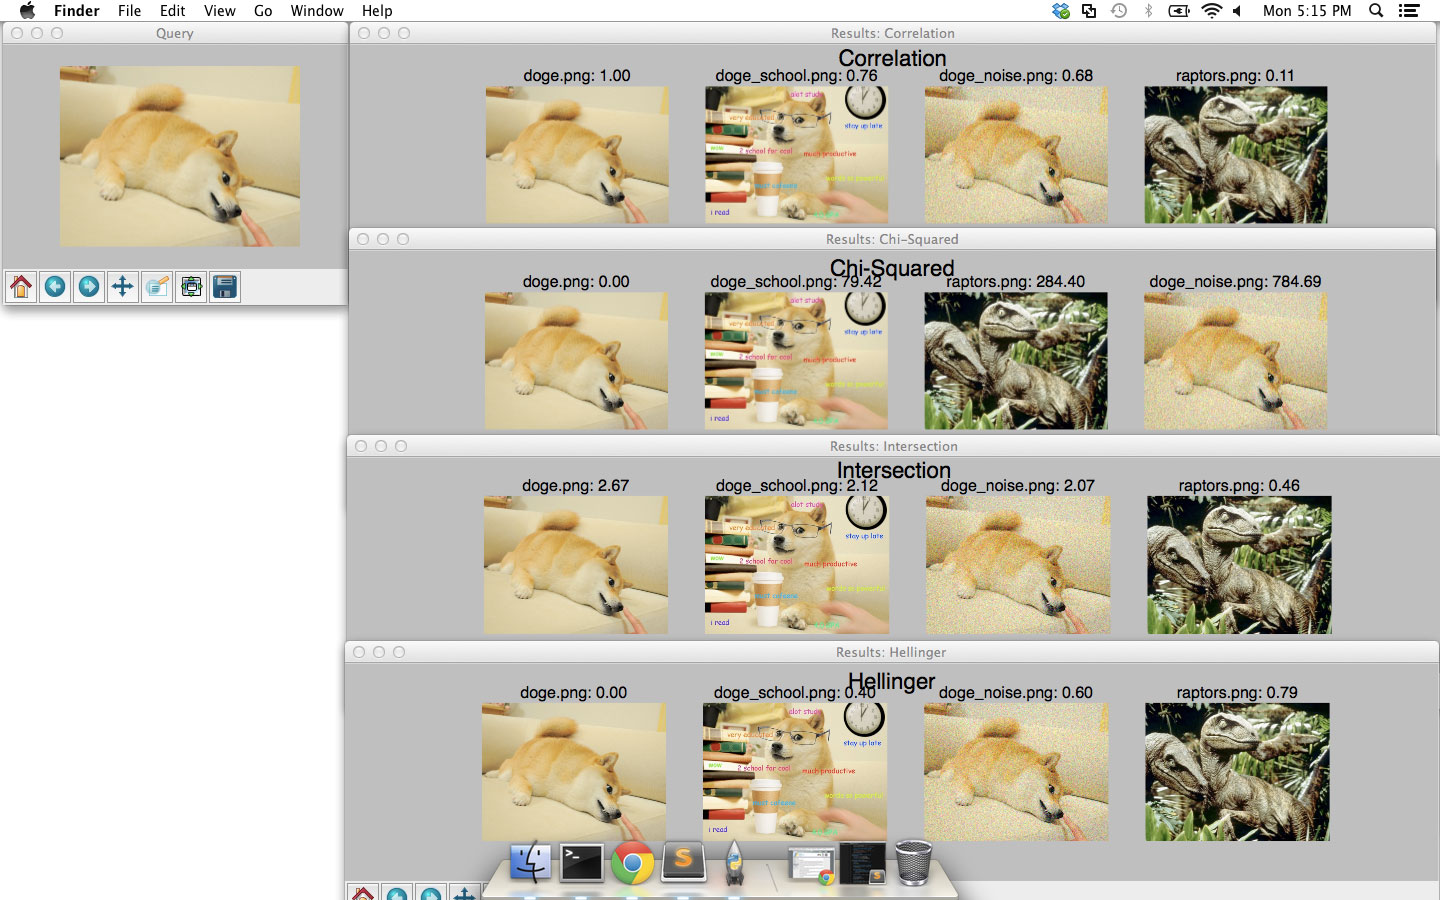
To start, we can compare two histograms for similarity and then, by proxy, determine how similar two images are:
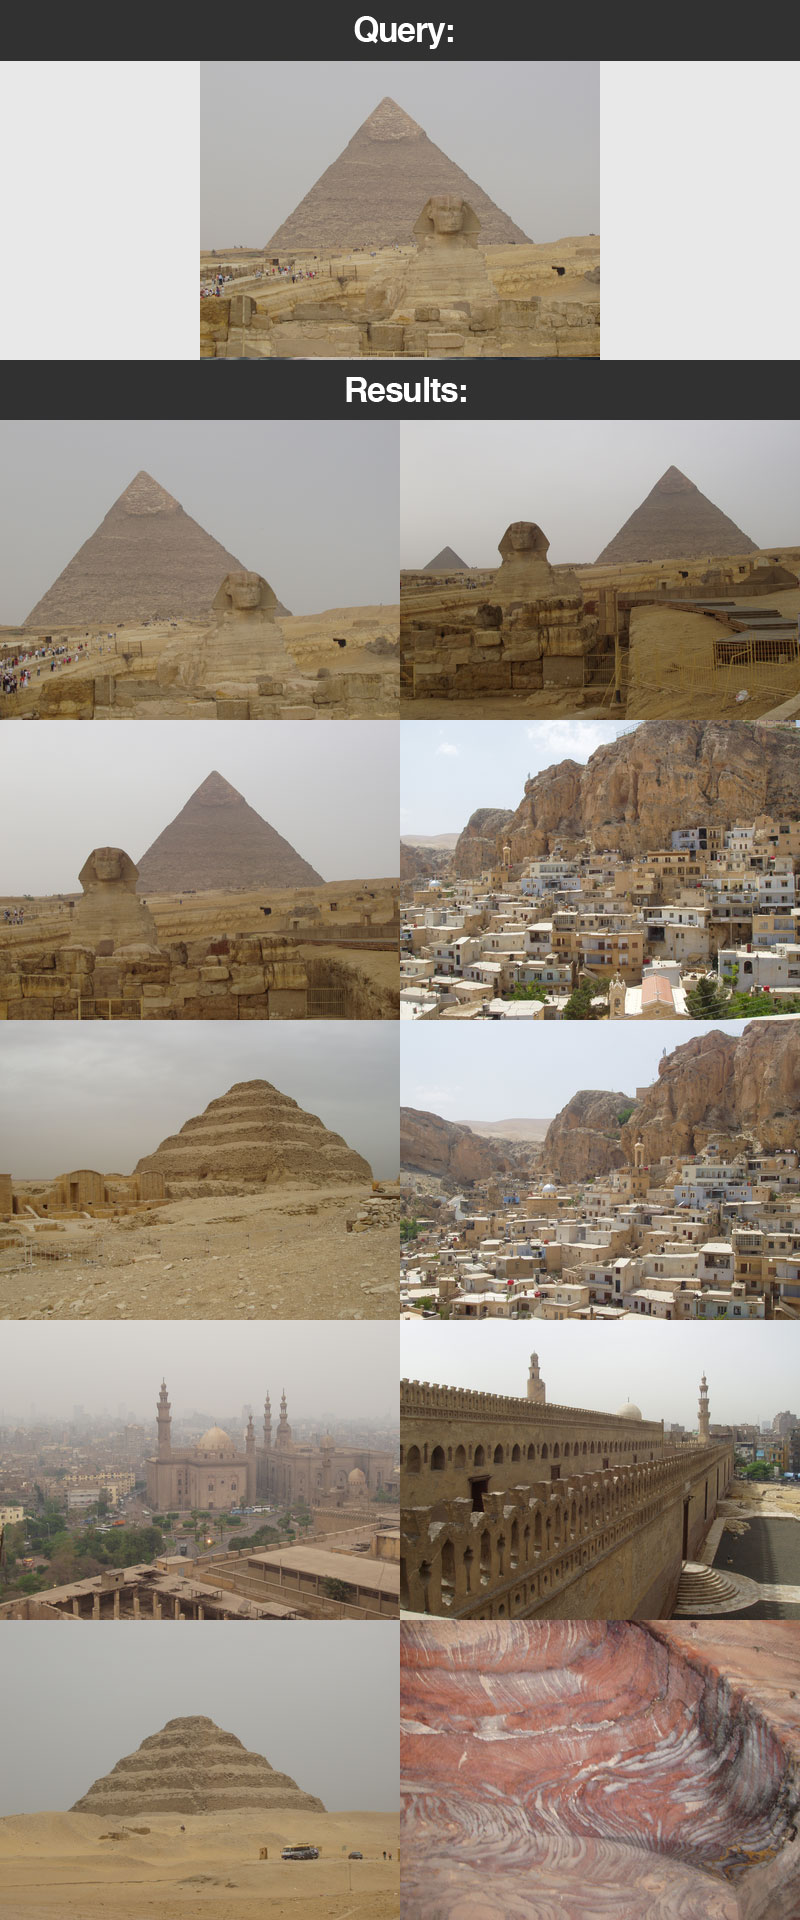
Once we understand how to compare histograms for similarity, we can scale up our system and build a complete image search engine which takes an input query image and compares the query image to a dataset of images, ranking the results by similarity:
How else can we quantify images?
The color histogram is arguably the simplest way to quantify the contents of an image — it’s easy to understand and comprehend. And it’s super efficient to compute.
The downside is that, by definition, color histograms only characterize the color of an image.
What if we wanted to describe the shape or texture of an image instead?
Is that possible?
You bet it is.
For shape, I would recommend using either the Hu Moments or Zernike Moments descriptors:
- http://www.pyimagesearch.com/2014/10/27/opencv-shape-descriptor-hu-moments-example/
- http://www.pyimagesearch.com/2014/04/07/building-pokedex-python-indexing-sprites-using-shape-descriptors-step-3-6/
In practice, Zernike Moments will tend to give you better accuracy, but they have the downside that you’ll need to tune the descriptor parameters to obtain optimal performance.
To quantify the texture of an image, consider using Local Binary Patterns (LBPs):
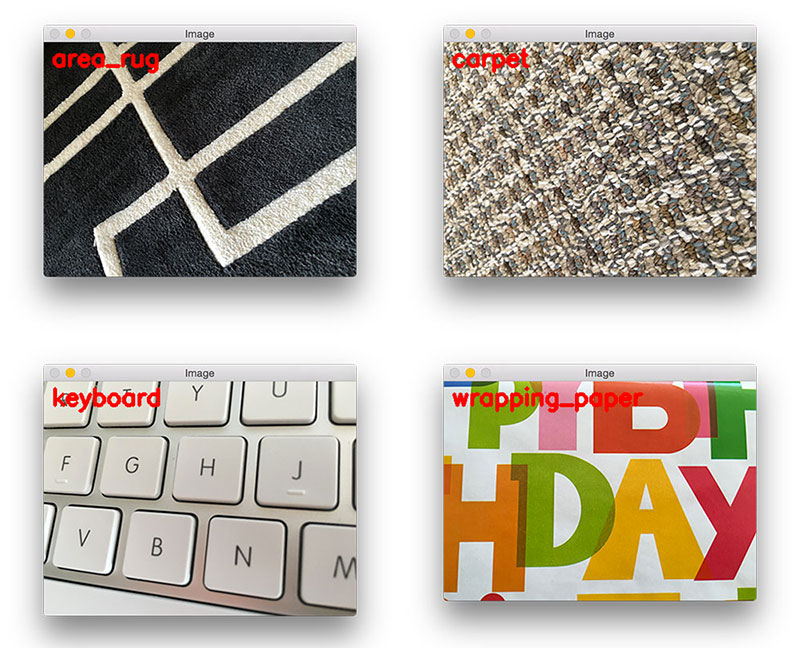
Combined with a bit of machine learning, you can actually recognize various textures and patterns in images.
Want to learn more about image descriptors?
We are only scratching the surface on how to quantify the contents of an image and recognize its contents.
The Case Studies portion of Practical Python and OpenCV includes two more examples of quantifying image contents:
- Histogram of Oriented Gradients for handwritten digit recognition.
- Color histograms for plant classification.
If you’re interested in learning more about image descriptors, it’s worth mentioning that I have 30+ lessons inside the PyImageSearch Gurus course dedicated to teaching various image descriptors, how they work, and how to apply them.
To learn more about the PyImageSearch Gurus course (and grab the free course syllabus), just click here.