Why are we bothering learning how to draw rectangles, circles, and lines in a book on computer vision and image processing?
Isn’t the point of computer vision to write software that understands the contents of an image? And if so, why in the world do we need to know how to draw various shapes on images?
Excellent questions.
Drawing by itself might not seem too exciting, but it’s important that you understand these techniques. While drawing by itself doesn’t allow us to visually understand the contents of an image using OpenCV, these operations allow us to draw Regions of Interest (ROIs) surrounding objects in an image.
These drawing operations are therefore applied after the more complex computer vision operations used for image understanding (which I’ll be discussing later inside Practical Python and OpenCV).
For more examples of drawing ROIs on an image, keep reading.
Examples of applying drawing techniques
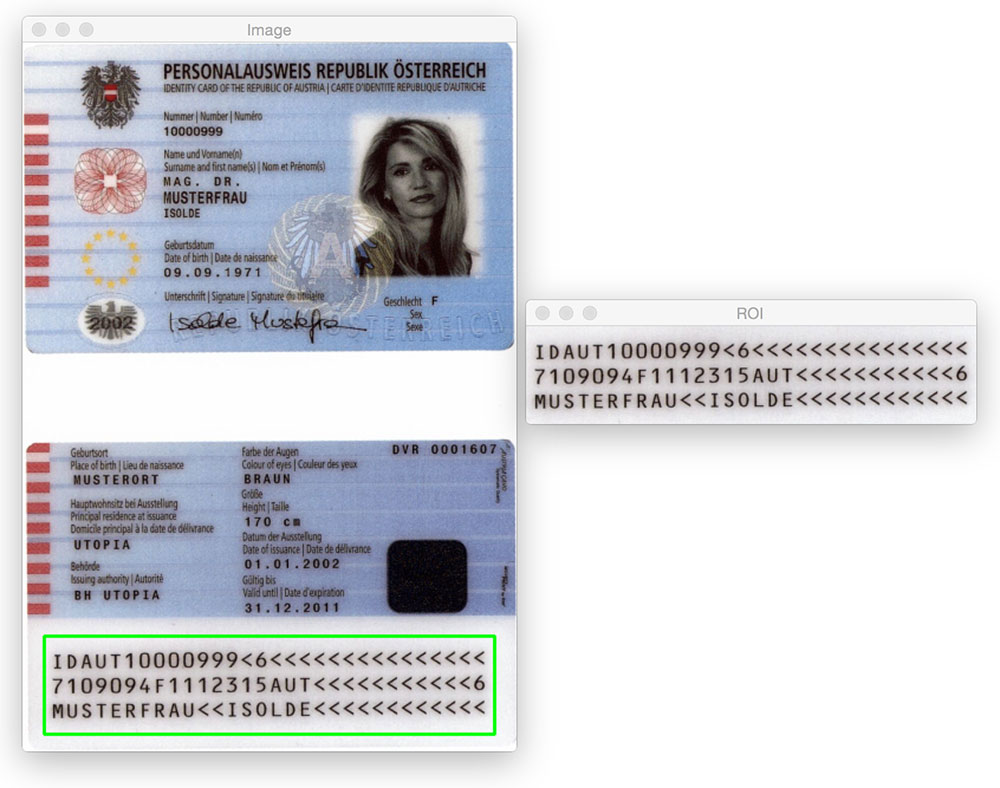
A simple example of applying the cv2.rectangle function can be found in the PyImageSearch blog post on detecting machine-readable zones (MRZs) in passport images. This post applies basic image processing operations to help us determine where the MRZ is in the image. Once we have found the MRZ, we draw a rectangle surrounding it and extract the MRZ from the original image.
You might also be interested in building your own home surveillance system:
In this case, we apply motion detection techniques to determine where in a video stream movement is. Once we have localized the movement, we draw a bounding box surrounding the motion on each individual frame. In the context of home surveillance, this results in a system that can detect a human (or animal, object, etc.) as it moves around the room.
To extend our motion detection example, we could also construct a home surveillance system that utilizes multiple cameras:
The same concept applies — detect motion in each of the video streams and then draw a bounding box surrounding the ROI(s) using the cv2.rectangle function.
Now, let’s say you wanted to detect cats in images using OpenCV:
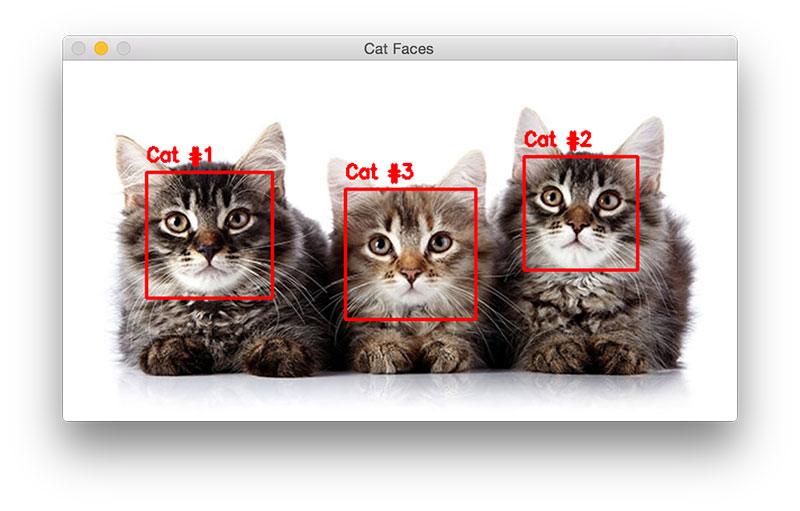
Once you have applied Haar cascades (which we’ll cover later in the Case Studies portion of Practical Python and OpenCV), you can loop over each of the detected regions and draw a bounding box for each detected cat.
Finally, you can also apply object tracking methods and the cv2.circle function to track in which direction an object is moving:
While OpenCV’s drawing functions may not have directly helped us locate, detect, or recognize an object in an image, they did allow us to visualize the results, which is still part of our image processing/computer vision pipeline.
Because of this, it’s important to understand basic drawing functions. Once you start working with more advanced computer vision algorithms, you’ll need a method to visualize your results — and drawing functions are how you will accomplish this.
Put your skills to the test
Instead of including a quiz for this chapter, I’ve included a little “coding challenge” that you can use to put your drawing skills to the test.
Your goal is to reproduce the following image using as little code as possible:
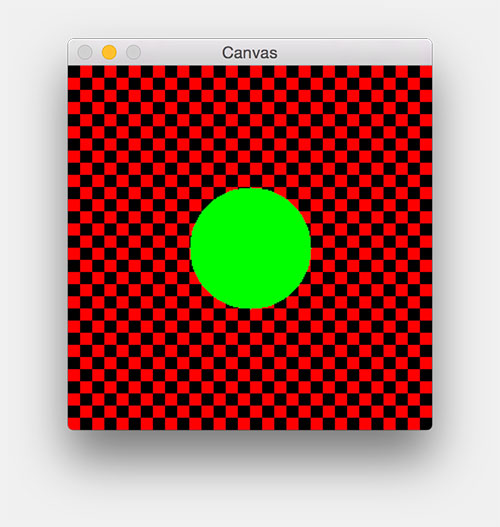
Hint: My script was able to draw this image in 13 lines of code, minus the comments and newline breaks.
If you get stuck, or want to see my solution, you can download my Python script here — but no peeking until you’ve at least given it a try!